My analysis of experiential learning interview data from the campus of a large American university in Asia is underway. I've moved all transcripts into Excel for coding. Contact me if you are interested in this process, as it provides a useful method to code, and then to sort and export the data for the next stages of analysis.
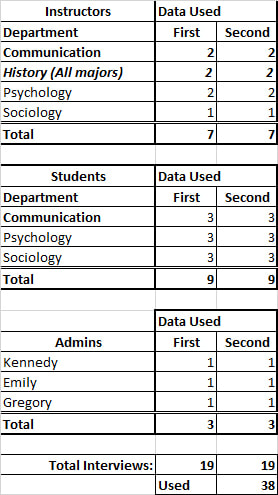
The table below shows the categories of interview participants. I may trim a few, but at this time, I'll have 19 first interviews and 19 second interviews. I'd be happy to share information about the two-stage process I used for the interviews . . . or you could read the dissertation when it is published. ;-)
My current activities involve completing the initial coding process. The interviews contain wonderful insights from students, instructors, and administrators. Now my task is to make sense of the data (e.g., see Coffee & Atkinson, 1966) with initial codes. Then I will be looking for categories that group common codes, and finally, for themes.
Coffey, A., & Atkinson, P. (1996). Making sense of qualitative data: Complementary research strategies. Thousand Oaks, CA, US: Sage Publications, Inc.

 RSS Feed