EXPERIENTIAL LEARNING
  • Home
  • Blog - Online Learning
  • Blog - Research
  • About
  • Media Coverage
  • Experiential Learning Examples
    • Experiential Learning Vietnam 2017
    • Monopoly for Teamwork
    • Learning in Hanoi
    • Hanoi Community Service
    • Saigon Starbucks Experience
    • Saigon Class Concert
    • Outside the Classroom
  • Blog - Personal

Student Linquistic abilities

6/30/2019

0 Comments

 
I am analyzing the interview data I collected from students for my PhD dissertation. Many of these students are amazing, especially in their linguistic abilities.

I'll let this excerpt from the transcript of one interview with a female student speak for itself. The student's name below is a pseudonym.
  • Paul: Okay. Uhm how many languages do you speak?
  • Mary: Four.
  • Paul: What are they?
  • Mary: Portuguese, Japanese, English and Spanish.
  • Paul: Wow!
  • Mary: Hmm.
  • Paul: That’s pretty impressive.
  • Mary: No, I wish I could be fluent in all of them. English and Spanish are the most challenging.
​
​I should add that the student's English during two long interviews was flawless.

#smartstudents
0 Comments

Excel & Word for qualitative data analysis

6/16/2019

0 Comments

 
I have continued to experiment with the use of MS Excel and Word to analyze qualitative date -- in this case, interview data for my PhD dissertation. The method described by Ose (2016) is amazing, although it has a few disadvantages.

Disadvantages include having online one major code for each interviewee quote. In my spreadsheet, I have an additional column for a secondary code, but I do not include that column when going through Ose's (2016) steps to convert the Excel file for Word. I use the added column as a reference as I work with the Word file during my secondary coding, categorizing, and creation of themes.

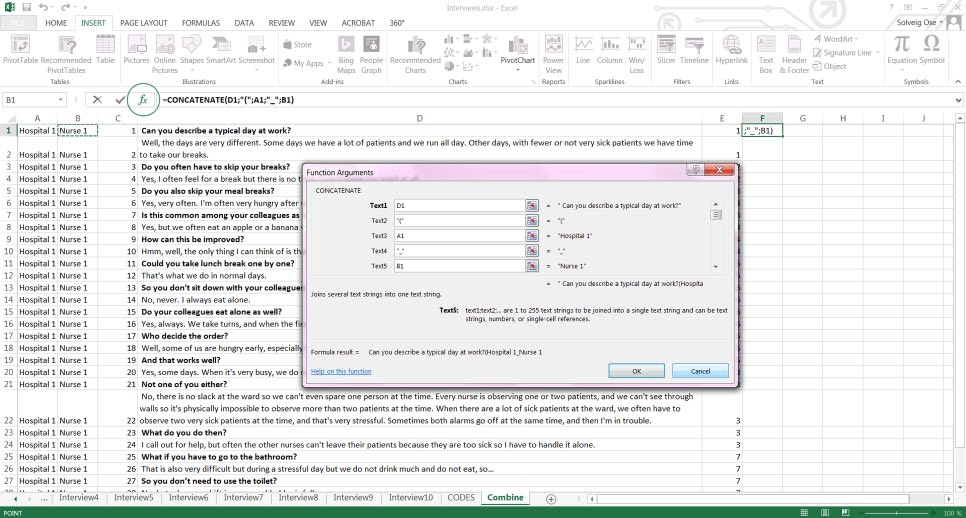
If you use her method as described in her paper, you will need to enlarge the Figure 10 and 11 screen shots. The concatenation instructions are complex, but trust what she writes, and pay special attention to the following on page 9:
F1 cell: =CONCATENATE(D1;"(";A1;"_";B1;"_";C1;")")
The "_" underscore symbols represent spaces, not use of the symbol, and in my instance of Excel, the semicolons were commas when I used the Function feature to create this string.

This is what the formula looks like in my file: 
=CONCATENATE(D1,"(",A1," ",B1," ",C1,")")

The screen shot below is Ose's (2016) Figure 6 image on page 9. Keep in  mind that there are additional "Text" boxes that aren't visible in this image.

Reference
Ose, S. O. (2016). Using Excel and Word to Structure Qualitative Data. Journal of Applied Social Science, 10(2), 147–162. https://doi.org/10.1177/1936724416664948


Picture
#dataanalysis #qualitativedata #interviewdata
0 Comments

Analyzing qualitative data - excel & word (QDA)

6/2/2019

0 Comments

 
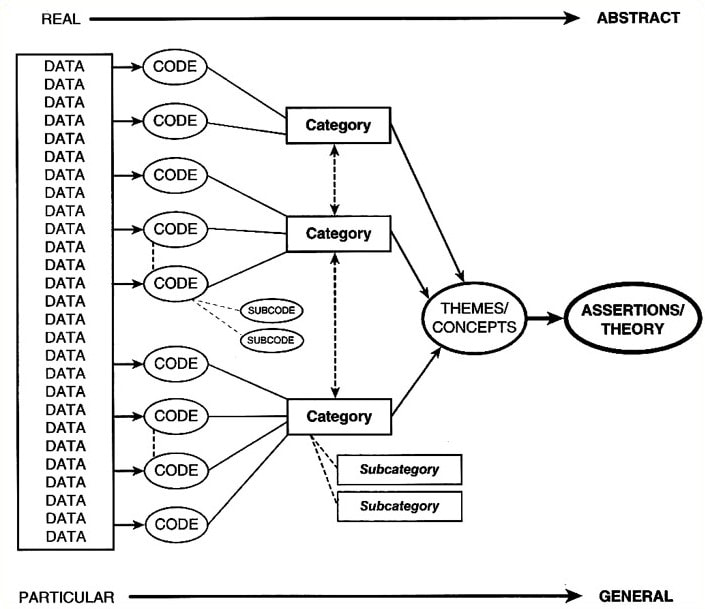
I have struggled to find the best way to compile and structure my interview data for analysis. The analytic methods will follow the direction provided by Saldaña (2015, pp. 14-15). These methods will include transcription of the recorded interviews, coding the transcribed data, categorizing the data, and developing themes and concepts. See Figure 3 below from Saldaña (2015, p. 14) for a graphic illustration of the process. The written report on the data will follow the recommendations of Saldaña (2015) and Seidman (2013). See the first figure below. This shows the process of developing categories and themes following coding of the interview data.

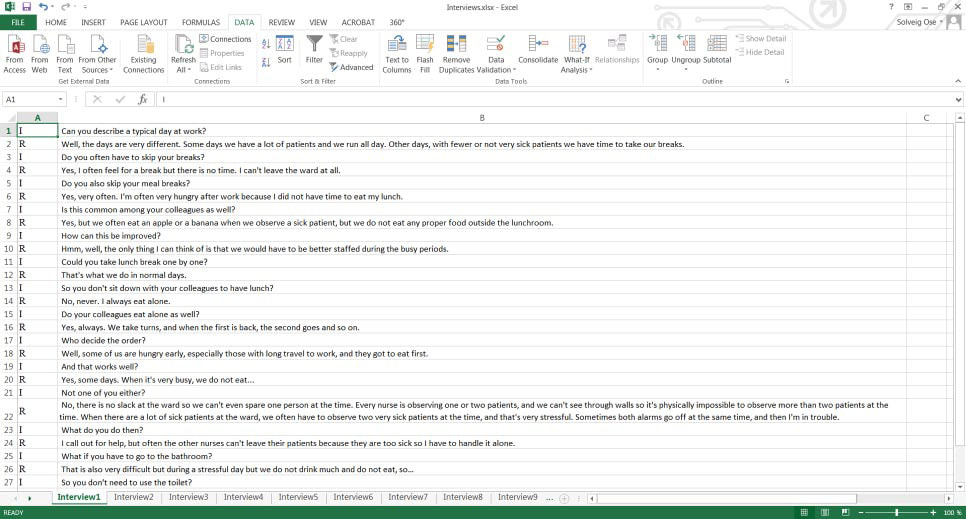
The challenge is in the process of finding an efficient method to analyze as many as 38 interviews, comprising first and second interviews from 19 participants. For researchers with similar challenges, I am sharing an article by Solveig Ose (2016) that provides a process to convert the MS Word transcripts of the interviews into tables in Excel for coding and analysis. See the second figure below. This is an illustration of the data copied from Word to Excel. This is part of the qualitative data analysis (QDA) process.
Picture
Figure 1. A model for moving from data through codes to themes and theories (Saldaña, 2015, p. 14).
Picture

Figure 2. Example of transcribed text in Excel (Ose, 2016, p. 5).
Ose, S. O. (2016). Using Excel and Word to Structure Qualitative Data. Journal of Applied Social Science, 10(2), 147–162. https://doi.org/10.1177/1936724416664948

Saldaña, J. (2015). The coding manual for qualitative researchers (Third ed.): Sage.
0 Comments

    Paul mcafee

    This blog summarizes research about active and experiential learning that I have read, and research that I have conducted.

    Archives

    January 2020
    July 2019
    June 2019
    May 2019
    April 2019
    January 2019
    December 2018
    November 2018
    August 2018
    May 2018
    April 2018
    February 2018
    October 2017
    August 2017
    July 2017
    June 2017
    April 2017

    Categories

    All
    Active Learning
    Analyzing Interview Data
    Coding Interview Data
    EndNote
    Experiential Learning
    Honor Society
    NVivo
    Online Teaching
    Passive Learning
    Paul McAfee
    Problem Based Learning
    Problem-Based Learning
    Project Based Learning
    Project-Based Learning
    Qualitative Data
    Qualitative Research
    Research Interviews
    Research Paradigms
    STEM Higher Education
    Veteran
    Vietnam
    Vietnam Education Foundation
    Voyant Tools

    RSS Feed

Copyright 2013-2019 Paul McAfee
LinkedIn Profile: www.linkedin.com/in/paulmcafee